

Subreports
Each customer shows its orders with a subreport, and the report ends with another one: a summary with a chart. Subreports read the main report’s datasets by name and filter them by the parameters they are given.
Standards: PDF/A-2b · PDF/UA-1, checked with veraPDF on every change. Download the PDF.
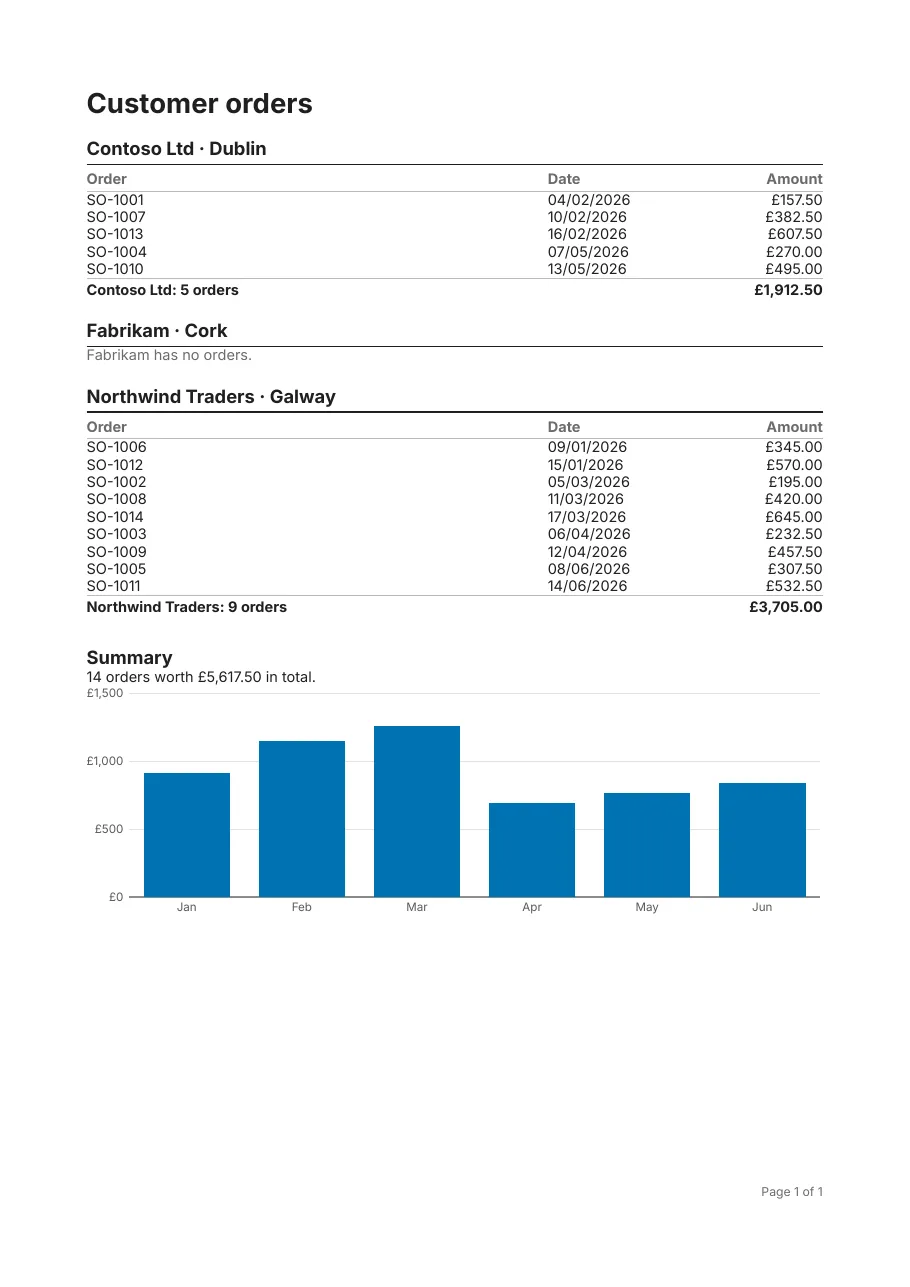
What it shows
Section titled “What it shows”- A subreport per row, with parameters
- A subreport at the end, with a chart
- Shared datasets filtered by parameters
- PDF/A-2b and PDF/UA-1, with the subreports’ fonts embedded too
The template
Section titled “The template”# yaml-language-server: $schema=../schema/template.schema.json# Subreports: each customer shows its orders with a subreport, and the report ends with a second one, a# summary with a chart. Subreports read the same data by dataset name and filter it by their parameters.# PDF/A-2b and PDF/UA-1: the subreports embed their fonts too.version: 1title: Customer ordersculture: en-GB
document: author: Acme Ltd compliance: [pdf-a-2b, pdf-ua-1]
page: size: A4 margins: 20mm
fonts: Inter: { regular: fonts/Inter-Regular.ttf, bold: fonts/Inter-Bold.ttf }
styles: default: { font: Inter, fontSize: 9.5pt, color: "#1F1F1F" } customer: { fontSize: 12pt, fontWeight: bold, borderBottom: "0.75pt solid #1F1F1F", padding: 0 0 3pt 0 }
data: customers: fields: { Id: int32, Name: string, City: string } orders: fields: { CustomerId: int32, Number: string, Date: date, Amount: decimal }
body: dataset: customers sort: [Name] reportHeader: - padding: 0 0 12pt 0 content: - { type: text, value: "Customer orders", fontSize: 18pt, fontWeight: bold, tag: h1 }
detail: - padding: 0 0 14pt 0 content: - { type: text, value: "{Name} · {City}", style: customer, tag: h2 } - type: subreport template: subreports/orders.report.yaml parameters: { customer: =Id, customerName: =Name }
reportFooter: - content: - { type: subreport, template: subreports/summary.report.yaml }
pageFooter: - content: - { type: text, value: "Page {PageNumber} of {TotalPages}", align: right, color: "#6B6B6B", fontSize: 8pt }# yaml-language-server: $schema=../../schema/template.schema.json# One customer's orders: used as a subreport by customers.report.yaml, which passes the customer.version: 1title: Ordersculture: en-GB
fonts: Inter: { regular: fonts/Inter-Regular.ttf, bold: fonts/Inter-Bold.ttf }
styles: default: { font: Inter, fontSize: 9.5pt, color: "#1F1F1F" } th: { fontWeight: bold, color: "#6B6B6B", borderBottom: "0.5pt solid #BBBBBB", padding: 4pt 0 2pt 0 } total: { fontWeight: bold, borderTop: "0.5pt solid #BBBBBB", padding: 2pt 0 0 0 }
parameters: customer: { type: int32 } customerName: { type: string }
data: orders: fields: { CustomerId: int32, Number: string, Date: date, Amount: decimal }
body: dataset: orders filter: =CustomerId == customer sort: [Date] reportHeader: - content: - type: table dataset: orders filter: =CustomerId == customer sort: [Date] headerStyle: th columns: - { header: Order, value: "{Number}", width: 1fr } - { header: Date, value: "{Date:d}", width: 90pt } - { header: Amount, value: "{Amount:C}", width: 90pt, align: right } footer: - style: total cells: - { value: "{customerName}: {Count(Number)} orders", span: 2 } - { value: "{Sum(Amount):C}", align: right } detail: [] noData: - content: - { type: text, value: "{customerName} has no orders.", color: "#6B6B6B", italic: true }# yaml-language-server: $schema=../../schema/template.schema.json# A summary of all orders, with a chart: used as a subreport at the end of customers.report.yaml.version: 1title: Summaryculture: en-GB
fonts: Inter: { regular: fonts/Inter-Regular.ttf, bold: fonts/Inter-Bold.ttf }
styles: default: { font: Inter, fontSize: 9.5pt, color: "#1F1F1F" }
data: orders: fields: { CustomerId: int32, Number: string, Date: date, Amount: decimal }
body: dataset: orders reportHeader: - padding: 6pt 0 0 0 content: - { type: text, value: "Summary", fontSize: 12pt, fontWeight: bold, tag: h2 } - { type: text, value: "{Count(Number)} orders worth {Sum(Amount):C} in total." } - type: chart dataset: orders sort: [Date] category: "{Date:MMM}" series: [ { name: Orders, value: =Amount } ] format: C0 height: 150pt alt: Column chart of the value of orders per month. detail: []Render it yourself
Section titled “Render it yourself”Save the template, put the fonts it names next to it (Inter and the Noto fonts are free, under the SIL Open Font License), and run:
tagua render customers.report.yaml --openWithout a data file, tagua render makes up sample rows from the field types; see Preview as you edit.