

Matrix (cross-tab)
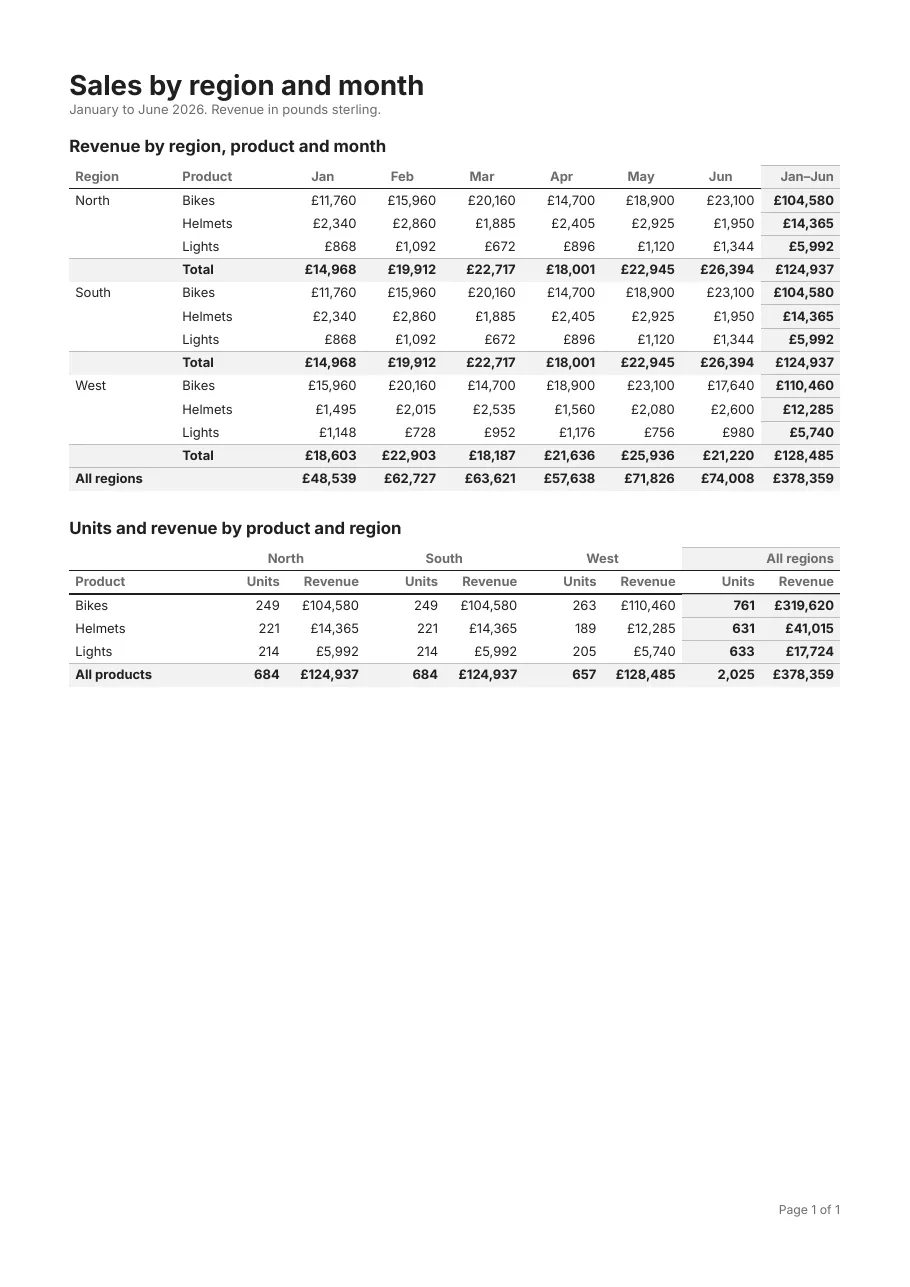
Two matrices over the same sales rows. The first groups revenue by region and product down the side and by month across the top, with a subtotal per region, a total per month and a grand total. The second shows units and revenue side by side for each region. A matrix is a table for screen readers: its column headers repeat on every page, and its row labels are row headers.
Standards: PDF/A-2b · PDF/UA-1, checked with veraPDF on every change. Download the PDF.
As a workbook
Section titled “As a workbook”The same report as an Excel workbook (download it), from tagua render matrix.report.yaml --out matrix.xlsx;
see Excel export.
| A | B | C | D | E | F | G | H | I | J | |
|---|---|---|---|---|---|---|---|---|---|---|
| 1 | Sales by region and month | |||||||||
| 2 | January to June 2026. Revenue in pounds sterling. | |||||||||
| 3 | Revenue by region, product and month | |||||||||
| 4 | Region | Product | Jan | Feb | Mar | Apr | May | Jun | Jan–Jun | |
| 5 | North | Bikes | £11,760 | £15,960 | £20,160 | £14,700 | £18,900 | £23,100 | £104,580 | |
| 6 | Helmets | £2,340 | £2,860 | £1,885 | £2,405 | £2,925 | £1,950 | £14,365 | ||
| 7 | Lights | £868 | £1,092 | £672 | £896 | £1,120 | £1,344 | £5,992 | ||
| 8 | Total | £14,968 | £19,912 | £22,717 | £18,001 | £22,945 | £26,394 | £124,937 | ||
| 9 | South | Bikes | £11,760 | £15,960 | £20,160 | £14,700 | £18,900 | £23,100 | £104,580 | |
| 10 | Helmets | £2,340 | £2,860 | £1,885 | £2,405 | £2,925 | £1,950 | £14,365 | ||
| 11 | Lights | £868 | £1,092 | £672 | £896 | £1,120 | £1,344 | £5,992 | ||
| 12 | Total | £14,968 | £19,912 | £22,717 | £18,001 | £22,945 | £26,394 | £124,937 | ||
| 13 | West | Bikes | £15,960 | £20,160 | £14,700 | £18,900 | £23,100 | £17,640 | £110,460 | |
| 14 | Helmets | £1,495 | £2,015 | £2,535 | £1,560 | £2,080 | £2,600 | £12,285 | ||
| 15 | Lights | £1,148 | £728 | £952 | £1,176 | £756 | £980 | £5,740 | ||
| 16 | Total | £18,603 | £22,903 | £18,187 | £21,636 | £25,936 | £21,220 | £128,485 | ||
| 17 | All regions | £48,539 | £62,727 | £63,621 | £57,638 | £71,826 | £74,008 | £378,359 | ||
| 18 | Units and revenue by product and region | |||||||||
| 19 | North | South | West | All regions | ||||||
| 20 | Product | Units | Revenue | Units | Revenue | Units | Revenue | Units | Revenue | |
| 21 | Bikes | 249 | £104,580 | 249 | £104,580 | 263 | £110,460 | 761 | £319,620 | |
| 22 | Helmets | 221 | £14,365 | 221 | £14,365 | 189 | £12,285 | 631 | £41,015 | |
| 23 | Lights | 214 | £5,992 | 214 | £5,992 | 205 | £5,740 | 633 | £17,724 | |
| 24 | All products | 684 | £124,937 | 684 | £124,937 | 657 | £128,485 | 2,025 | £378,359 | |
What it shows
Section titled “What it shows”- Nested row groups with subtotals and a grand total
- A total column, and two values under each column group
- Header and total styles
- Tagged as a table with column and row headers (PDF/UA-1)
The template
Section titled “The template”# yaml-language-server: $schema=../schema/template.schema.json# Matrices (cross-tabs): the sales rows grouped down the side by region and product and across the top by month,# with subtotals per region, a total per month and a grand total; then units and revenue side by side per region.# A matrix is laid out and tagged as a table: its column headers repeat on each page, and its row labels are row# headers for screen readers. PDF/A-2b and PDF/UA-1.version: 1title: Sales by region and monthculture: en-GB
document: author: Acme Ltd compliance: [pdf-a-2b, pdf-ua-1]
page: size: A4 margins: 16mm
fonts: Inter: { regular: fonts/Inter-Regular.ttf, bold: fonts/Inter-Bold.ttf }
styles: default: { font: Inter, fontSize: 8.5pt, color: "#1F1F1F" } head: { fontWeight: bold, color: "#6B6B6B", borderBottom: "0.75pt solid #1F1F1F", padding: 2pt 4pt 3pt 4pt } total: { fontWeight: bold, background: "#F2F2F2", borderTop: "0.5pt solid #BDBDBD" } cell: { padding: 2.5pt 4pt 2.5pt 4pt }
data: sales: fields: { Month: date, Region: string, Product: string, Revenue: decimal, Units: int32 }
body: dataset: sales reportHeader: - padding: 0 0 12pt 0 content: - { type: text, value: "Sales by region and month", fontSize: 18pt, fontWeight: bold, tag: h1 } - { type: text, value: "January to June 2026. Revenue in pounds sterling.", color: "#6B6B6B" }
- padding: 0 0 18pt 0 content: - { type: text, value: "Revenue by region, product and month", fontSize: 11pt, fontWeight: bold, tag: h2, padding: 0 0 6pt 0 } - type: matrix dataset: sales sort: [Month] headerStyle: head totalStyle: total rows: - { group: "{Region}", header: Region, total: All regions, width: 70pt, style: cell } - { group: "{Product}", header: Product, total: Total, width: 70pt, style: cell } columns: - { group: "{Month:MMM}", total: Jan–Jun } values: - { value: =Revenue, format: C0, style: cell }
- content: - { type: text, value: "Units and revenue by product and region", fontSize: 11pt, fontWeight: bold, tag: h2, padding: 0 0 6pt 0 } - type: matrix dataset: sales sort: [Product] headerStyle: head totalStyle: total rows: - { group: "{Product}", header: Product, total: All products, width: 90pt, style: cell } columns: - { group: "{Region}", total: All regions } values: - { header: Units, value: =Units, format: N0, style: cell } - { header: Revenue, value: =Revenue, format: C0, style: cell } detail: []
pageFooter: - content: - { type: text, value: "Page {PageNumber} of {TotalPages}", align: right, color: "#6B6B6B", fontSize: 8pt }Render it yourself
Section titled “Render it yourself”Save the template, put the fonts it names next to it (Inter and the Noto fonts are free, under the SIL Open Font License), and run:
tagua render matrix.report.yaml --openWithout a data file, tagua render makes up sample rows from the field types; see Preview as you edit.