

Matrix element
A matrix (a cross-tab, or pivot table): a dataset’s rows grouped down the side by rows and across the top by columns, with each of values aggregated in every cell where a row group and a column group meet. Groups appear in the order their first row does (after filter and sort), and a group with a total is followed by a total of its instances. It is laid out and tagged as a table: column headers repeat on every page it continues onto, and the row labels are row headers.
- { type: matrix, dataset: ..., values: ... }Example
Section titled “Example”title: Sales by region and monthculture: en-USstyles: header: { fontWeight: bold, borderBottom: "0.75pt solid #000000", padding: 2pt 3pt } total: { fontWeight: bold, background: "#F2F2F2" } cell: { padding: 2pt 3pt }data: sales: { fields: { Month: date, Region: string, Product: string, Revenue: decimal } }body: reportHeader: - content: - type: matrix dataset: sales sort: [Month, Region] headerStyle: header totalStyle: total rows: - { group: "{Region}", header: Region, total: All regions, style: cell } - { group: "{Product}", header: Product, total: Total, style: cell } columns: - { group: "{Month:MMM}", total: Q1 } values: - { value: =Revenue, format: C0, style: cell }data: sales: - { Month: 2026-01-01, Region: North, Product: Bikes, Revenue: 42000 } - { Month: 2026-01-01, Region: North, Product: Parts, Revenue: 6100 } - { Month: 2026-01-01, Region: South, Product: Bikes, Revenue: 31000 } - { Month: 2026-02-01, Region: North, Product: Bikes, Revenue: 45500 } - { Month: 2026-02-01, Region: South, Product: Bikes, Revenue: 36800 } - { Month: 2026-02-01, Region: South, Product: Parts, Revenue: 4900 } - { Month: 2026-03-01, Region: North, Product: Bikes, Revenue: 51200 } - { Month: 2026-03-01, Region: North, Product: Parts, Revenue: 7300 } - { Month: 2026-03-01, Region: South, Product: Bikes, Revenue: 40100 }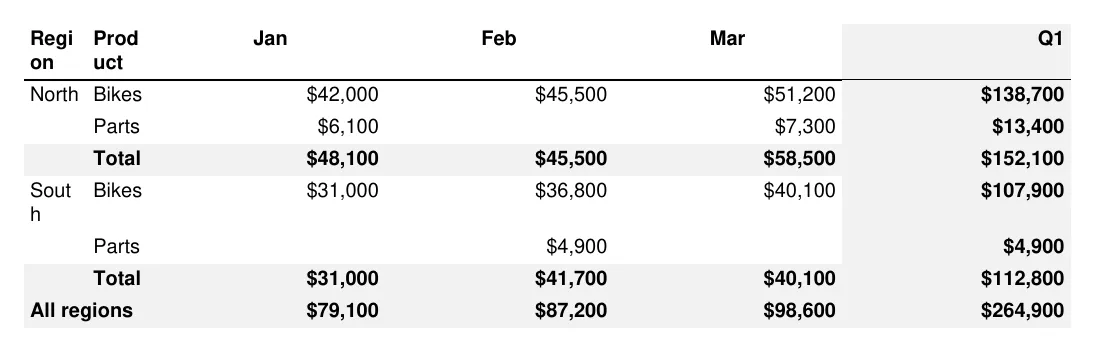
Properties
Section titled “Properties”dataset
Section titled “dataset”Type: text · Required
The dataset whose rows are summarised.
filter
Section titled “filter”Type: expression
Keeps only the rows for which this is true; Parent.X reads the enclosing row.
Type: list of sort key
Row order, which is also the order the groups appear in.
Type: list of object
The row groups, outermost first: a column of labels each, down the left (the right in rtl text). None gives one row of values (or a row per value, with valuesInRows).
columns
Section titled “columns”Type: list of object
The column groups, outermost first: a row of labels each, across the top. None gives one column per value.
values
Section titled “values”Type: list of object · Required
What each cell shows: one value, or several side by side under each column group.
valuesInRows
Section titled “valuesInRows”Type: true or false · Default: false
Lists the values down instead: a row for each under every row group, headed by the value’s header, and one column under each column group.
columnWidth
Section titled “columnWidth”Type: length · Default: 1fr
The width of each value column: pt (or another unit), % or fr (a share of the width the row labels leave).
headerStyle
Section titled “headerStyle”Type: text
A named style for the column headers, and the row groups’ titles above their labels.
totalStyle
Section titled “totalStyle”Type: text
A named style for total rows and total columns.
repeatHeader
Section titled “repeatHeader”Type: true or false · Default: true
Repeats the column headers on every page the matrix continues onto.
emptyText
Section titled “emptyText”Type: text
Text shown instead of the matrix when there are no rows.
groups
Section titled “groups”Each entry of rows and columns. Groups also have the style properties, which apply to their labels.
Type: text
A named style for the group’s labels.
Type: list of object
Styles for the group’s labels that apply, label by label, where their condition holds. A condition reads the group’s rows: aggregates over them (=Sum(Amount) < 0), other names from the first.
Type: text · Required
Text template: each row’s group, which is also the group’s label, e.g. "{Region}" or "{Date:MMM yyyy}".
header
Section titled “header”Type: text
A row group’s title, above its column of labels (text template).
Type: text
Adds a total of the group’s instances, labelled with this text (template): after each instance of the enclosing group, or at the end for the outermost group, as the grand total.
totalBefore
Section titled “totalBefore”Type: true or false · Default: false
Puts the total before the group’s instances (above them, or to their left) instead of after them.
beside
Section titled “beside”Type: list of object
Rows (for a row group) or columns (for a column group) beside the group’s instances, each with a label and values of its own, such as an average beside a total, or a customer’s grade beside their monthly sales.
Type: length
A row group’s label column width: pt (or another unit), % or auto (as wide as its labels, the default).
values
Section titled “values”Each entry of values. Values also have the style properties, which apply to their cells.
Type: text
A named style for the value’s cells.
header
Section titled “header”Type: text
The value’s header (text template), shown under each column group when there are several values.
Type: expression · Required
A number per row (or anything, for count), aggregated per cell. Or an expression with aggregates, computed once per cell over the cell’s rows, such as =Sum(Amount) / Sum(Quantity) or =First(Grade): it can be text.
aggregate
Section titled “aggregate”Type: keyword · Default: sum
How the values of a cell’s rows are combined, when the value holds no aggregates of its own.
One of:
sumavgcountminmax
format
Section titled “format”Type: text
.NET format for the cells, e.g. C0 or N1.
Type: list of object
Styles for the value’s cells that apply, cell by cell, where their condition holds. A condition is worked out per cell, as a value with aggregates is: =Sum(Amount) < 0 over the cell’s rows; other names read its first row.
It also has the properties of every element and the style properties.