

Replace ReportViewer and RDLC on .NET 8, 9 and 10
Many .NET applications print their invoices, statements and lists with RDLC reports, rendered locally by Microsoft’s ReportViewer control. ReportViewer belongs to .NET Framework, Windows Forms and Web Forms: there is no Microsoft-supported way to render RDLC in ASP.NET Core, in a Linux container or with native AOT. Rewriting every report by hand in another tool is the usual way out, and the slow one.
Tagua converts them instead. tagua import reads an RDLC or RDL report (SSRS and ReportViewer, RDL 2005 to 2016) and
writes a Tagua template that loads and renders straight away, with a list of anything that needs a second look.
Nothing is dropped silently.
Convert a report
Section titled “Convert a report”-
Install the
taguacommand:Terminal window dotnet tool install --global Tagua.Cli -
Convert the report. Embedded images are written next to the template.
Terminal $ tagua import Invoice.rdlcInvoice.report.yaml: converted, with 1 image(s).1 thing(s) to review (placeholders in the template are marked [RDLC ...]):- Textbox 'Custom': The expression =Code.Greeting(First(Fields!CustomerName.Value, "Invoice")) was not converted (custom code (Code.Greeting)).This invoice converted, apart from one expression that calls custom code (
Code.Greeting), which Tagua’s sandboxed expressions cannot run. It is left as a visible[RDLC …]placeholder to replace by hand. -
Look at it, with sample data made up from the field types, rendered again on every save while you work on it:
Terminal window tagua render Invoice.report.yaml --watch --open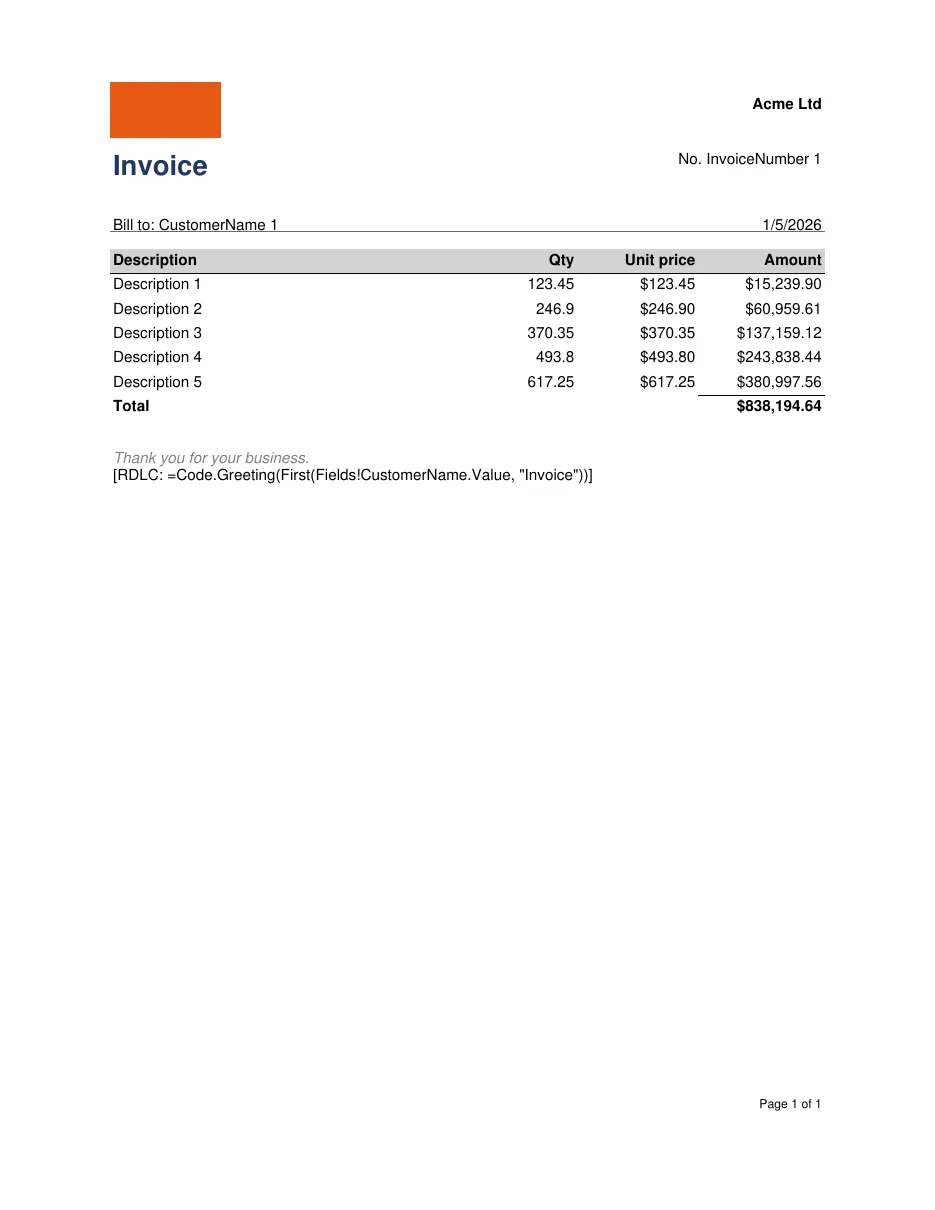
The converted template
# Converted from Invoice.rdlc by Tagua.Import.version: 1title: Invoiceculture: en-US
page: { size: Letter, margins: 54pt 72pt 54pt 72pt }
parameters:  CompanyName: { type: string, label: Company name, default: "='Acme Ltd'" }  ShowNotes: { type: boolean, label: Show notes, default: "=true" }
data:  Invoice:    fields: { InvoiceNumber: string, CustomerName: string, IssueDate: dateTime }  Lines:    fields: { Description: string, Quantity: decimal, UnitPrice: decimal }
styles:  default: { font: Arial, fontSize: 10pt }  linesTableHeader: { background: "#D3D3D3", padding: 2pt, borderBottom: "1pt solid #000000", fontWeight: bold }
body:  dataset: Invoice  reportHeader:    - layout: absolute      height: 28.8pt      content:        - type: text          x: 0pt          y: 0pt          width: 216pt          value: Invoice          padding: 2pt          font: Segoe UI          fontSize: 18pt          fontWeight: bold          color: "#1F3864"        - type: text          x: 324pt          y: 0pt          width: 144pt          value: "No. {First(InvoiceNumber, 'Invoice')}"          padding: 2pt          align: right    - layout: absolute      height: 18pt      padding: 14.4pt 0 0 0      content:        - type: text          x: 0pt          y: 0pt          width: 252pt          value: "Bill to: {First(CustomerName, 'Invoice')}"          padding: 2pt        - type: text          x: 324pt          y: 0pt          width: 144pt          value: "{First(IssueDate, 'Invoice'):d}"          padding: 2pt          align: right    - layout: absolute      height: 1pt      padding: 7.2pt 0 0 0      content:        - { type: line, x: 0pt, y: 0pt, width: 468pt, stroke: "0.75pt solid #696969", tag: artifact }    - padding: 18pt 0 0 0      content:        - type: table          dataset: Lines          sort: [Description]          columns:            - { header: Description, value: "{Description}", width: 252pt, padding: 2pt }            - { header: Qty, value: "{Quantity:0.##}", width: 54pt, padding: 2pt, align: right }            - { header: Unit price, value: "{UnitPrice:C2}", width: 79.2pt, padding: 2pt, align: right }            - { header: Amount, value: "{Quantity * UnitPrice:C2}", width: 82.8pt, padding: 2pt, align: right }          headerStyle: linesTableHeader          footer:            - cells:                - { value: Total, span: 3, padding: 2pt, fontWeight: bold }                - value: "{Sum(Quantity * UnitPrice):C2}"                  padding: 2pt                  borderTop: "1pt solid #000000"                  fontWeight: bold                  align: right          width: 468pt    - layout: absolute      height: 18pt      padding: 18pt 0 0 0      content:        - type: text          x: 0pt          y: 0pt          width: 468pt          value: Thank you for your business.          padding: 2pt          italic: true          color: "#808080"          visible: "=ShowNotes"    - layout: absolute      height: 18pt      padding: 10.8pt 0 0 0      content:        - type: text          x: 0pt          y: 0pt          width: 468pt          value: "[RDLC: =Code.Greeting(First(Fields!CustomerName.Value, \"Invoice\"))]"          padding: 2pt  pageHeader:    - layout: absolute      height: 43.2pt      content:        - type: image          x: 0pt          y: 0pt          width: 72pt          height: 36pt          source: images/Logo.png          fit: contain          alt: Acme logo        - type: text          x: 324pt          y: 7.2pt          width: 144pt          value: "{CompanyName}"          padding: 2pt          fontWeight: bold          align: right  detail: []  pageFooter:    - layout: absolute      height: 28.8pt      content:        - type: text          x: 324pt          y: 7.2pt          width: 144pt          value: "Page {PageNumber} of {TotalPages}"          padding: 2pt          fontSize: 8pt          align: right
Connect your data
Section titled “Connect your data”In ReportViewer, data came in as ReportDataSources named after the report’s datasets. In Tagua the template’s
data section keeps those names (Invoice and Lines here), and you pass rows under the same names, from memory
or straight from a database reader:
var report = CompiledReport.Compile(TemplateLoader.LoadFile("Invoice.report.yaml"));var inputs = new ReportInputs{ Parameters = new Dictionary<string, object?> { ["CompanyName"] = "Contoso Ltd" }, Data = new Dictionary<string, IDataSet> { ["Invoice"] = DataSources.FromRows([invoice]), ["Lines"] = DataSources.FromDataReader(async ct => { var command = connection.CreateCommand(); command.CommandText = "select Description, Quantity, UnitPrice from InvoiceLines where InvoiceId = @id"; command.Parameters.Add(new SqlParameter("@id", invoiceId)); return await command.ExecuteReaderAsync(ct); }), }, Resources = new DirectoryResourceResolver("reports"),};await using var pdf = File.Create("invoice.pdf");await Reports.RenderPdfAsync(report, inputs, pdf);It runs anywhere .NET 10 runs: ASP.NET Core, a worker, a Linux container, native AOT.
What converts
Section titled “What converts”- Data: datasets and their fields with types, report parameters with prompts and defaults.
- Page: size, orientation, margins, language, page header and footer.
- Items: text boxes with their formatting and
Format, images (embedded, external and from fields), lines, rectangles, visibility (Hidden), bookmarks. - Data regions: tables, the first grouped table or list as the report’s groups (with group headers, footers and page breaks), lists, charts (column, bar, line, area, pie, doughnut) and subreports.
- Expressions, translated from Visual Basic: fields and parameters,
Globals, aggregates with their scope,IIfandSwitch, formatting, conversion, string, date and math functions, and the operators. A concatenation such as="Page " & Globals!PageNumberbecomes the text templatePage {PageNumber}.
What needs a person
Section titled “What needs a person”These leave an [RDLC …] placeholder and an entry in the list, so you can find and finish them:
- custom code (
Code.…),RowNumber,RunningValue,Previous,LookupandReportItems!…; - matrices with column groups, and more than one grouped table;
- other chart types, gauges, maps, data bars and indicators;
- expressions in styles (conditional colours), drill-down toggles, dataset filters and calculated fields (supply the rows filtered and computed).
From code
Section titled “From code”The converter is also a library, Tagua.Import, for converting many reports at once:
var result = RdlcImporter.Import("Invoice.rdlc");File.WriteAllText("Invoice.report.yaml", result.Yaml);foreach (var issue in result.Issues) Console.WriteLine(issue);