
RDLC migration examples
Two reports, converted with tagua import and rendered as they are, step by step. We wrote them for this page, with
the patterns real RDLC reports are full of; the company in them is made up. Download each .rdlc to try the
conversion yourself, and see the migration guide for everything else.
A sales invoice
Section titled “A sales invoice”SalesInvoice.rdlc prints one invoice per page, from one dataset with a row per invoice line. Reports designed for Dynamics NAV and Business Central are built like this, and it shows what such reports need:
- Values in the page header. An RDLC page header cannot read fields, so a hidden text box in the invoice’s group
row joins the customer’s name, address, invoice number and date, and each header text box picks one:
=Choose(3, Split(CStr(ReportItems!HeaderValues.Value), Chr(177))). - Formats from the data. The amounts’
Formatis=Fields!AmountFormat.Value, the format each invoice’s currency needs. - A flag. The unit price column hides where
=IIF(Fields!ShowUnitPrice.Value = True, False, True), and the field has no declared type. - A logo from the data. The company picture is a field, shown with
=Convert.ToBase64String(First(Fields!CompanyPicture.Value, "DataSet_Result")). - The user’s name. The footer prints
="Printed by " & User!UserID.
$ tagua import SalesInvoice.rdlcSalesInvoice.report.yaml: converted.Nothing to review.3 note(s): - DataSet 'DataSet_Result', field 'ShowUnitPrice': No type is declared; it is read as boolean, from how the report uses it. - DataSet 'DataSet_Result', field 'CompanyPicture': No type is declared; it is read as bytes, from how the report uses it. - Parameter 'UserID': User!UserID reads this parameter: pass the user's name in the report's parameters (it is empty otherwise).Nothing to review. The notes are what your application supplies: ShowUnitPrice is read as a boolean and
CompanyPicture as bytes, the types the report uses them as, and the user’s name is a parameter, UserID. In the
template, the page header reads the page’s first row directly, so the hidden text box and its Split are gone:
Invoice {Format(DocumentNo)}. The amounts are {Format(LineAmount, AmountFormat)}, and the unit prices show where
ShowUnitPrice is true, as in RDLC.
The converted template, SalesInvoice.report.yaml
# Converted from SalesInvoice.rdlc by Tagua.Import.version: 1title: SalesInvoiceculture: en-US
page: { size: A4, margins: 56.69pt }
parameters:  UserID: { type: string, label: User, default: "=''" }
data:  DataSet_Result:    fields:      DocumentNo: string      CustomerName: string      CustomerAddress: string      DocumentDate: dateTime      Description: string      Quantity: decimal      UnitPrice: decimal      LineAmount: decimal      AmountFormat: string      ShowUnitPrice: boolean      CompanyPicture: bytes
styles:  default: { font: Arial, fontSize: 10pt }
body:  dataset: DataSet_Result  sort: [DocumentNo]  pageHeader:    - layout: absolute      height: 113.39pt      content:        - type: text          x: 0pt          y: 0pt          width: 255.12pt          value: Sales Invoice          padding: 2pt          font: Arial          fontSize: 16pt          fontWeight: bold        - type: image          x: 311.81pt          y: 0pt          width: 170.08pt          height: 51.02pt          source: "{First(CompanyPicture, 'DataSet_Result')}"          fit: contain          tag: artifact        - type: text          x: 0pt          y: 31.18pt          width: 255.12pt          value: "Invoice {Format(DocumentNo)}"          padding: 2pt          font: Arial          fontSize: 9pt          fontWeight: bold        - type: text          x: 0pt          y: 48.19pt          width: 255.12pt          value: "Date: {Format(Format(DocumentDate, 'd'))}"          padding: 2pt          font: Arial          fontSize: 9pt        - type: text          x: 0pt          y: 70.87pt          width: 255.12pt          value: "{Format(CustomerName)}"          padding: 2pt          font: Arial          fontSize: 9pt          fontWeight: bold        - type: text          x: 0pt          y: 87.87pt          width: 255.12pt          value: "{Format(CustomerAddress)}"          padding: 2pt          font: Arial          fontSize: 9pt  groups:    - name: document      by: DocumentNo      pageBreak: between      header:        - layout: row          minHeight: 2.83pt          visible: "=false"          content:            - type: text              value: "{First(CustomerName) + '±' + First(CustomerAddress) + '±' + First(DocumentNo) + '±' + Format(First(DocumentDate), 'd')}"              width: 481.89pt              padding: 2pt              font: Arial              fontSize: 9pt        - layout: row          minHeight: 19.84pt          content:            - type: text              value: Description              width: 226.77pt              padding: 2pt              font: Arial              fontSize: 9pt              fontWeight: bold            - type: text              value: Quantity              width: 70.87pt              padding: 2pt              font: Arial              fontSize: 9pt              fontWeight: bold              align: right            - type: text              value: Unit price              width: 85.04pt              padding: 2pt              font: Arial              fontSize: 9pt              fontWeight: bold              align: right              visible: "=!(First(ShowUnitPrice) == true ? false : true)"            - type: text              value: Amount              width: 99.21pt              padding: 2pt              font: Arial              fontSize: 9pt              fontWeight: bold              align: right      footer:        - layout: row          minHeight: 19.84pt          content:            - type: text              value: Total              width: 382.68pt              padding: 2pt              font: Arial              fontSize: 9pt              fontWeight: bold            - type: text              value: "{Format(Sum(LineAmount), First(AmountFormat))}"              width: 99.21pt              padding: 2pt              font: Arial              fontSize: 9pt              fontWeight: bold              align: right  detail:    - layout: row      minHeight: 17.01pt      content:        - { type: text, value: "{Description}", width: 226.77pt, padding: 2pt, font: Arial, fontSize: 9pt }        - type: text          value: "{Quantity}"          width: 70.87pt          padding: 2pt          font: Arial          fontSize: 9pt          align: right        - type: text          value: "{Format(UnitPrice, AmountFormat)}"          width: 85.04pt          padding: 2pt          font: Arial          fontSize: 9pt          align: right          visible: "=!(ShowUnitPrice == true ? false : true)"        - type: text          value: "{Format(LineAmount, AmountFormat)}"          width: 99.21pt          padding: 2pt          font: Arial          fontSize: 9pt          align: right  pageFooter:    - layout: absolute      height: 28.35pt      content:        - type: text          x: 0pt          y: 5.67pt          width: 255.12pt          value: "Printed by {UserID}"          padding: 2pt          font: Arial          fontSize: 9pt          color: "#696969"        - type: text          x: 311.81pt          y: 5.67pt          width: 170.08pt          value: "Page {PageNumber} of {TotalPages}"          padding: 2pt          font: Arial          fontSize: 9pt          color: "#696969"          align: right
Render it from your application, with the rows the report always had and the user’s name:
var template = TemplateLoader.LoadFile("SalesInvoice.report.yaml");var report = CompiledReport.Compile(template);var lines = DataSources.FromDataReader(ct => command.ExecuteReaderAsync(ct));var inputs = new ReportInputs{ Parameters = new Dictionary<string, object?> { ["UserID"] = user.Name }, Data = new Dictionary<string, IDataSet> { ["DataSet_Result"] = lines },};await using var pdf = File.Create("invoices.pdf");await Reports.RenderPdfAsync(report, inputs, pdf);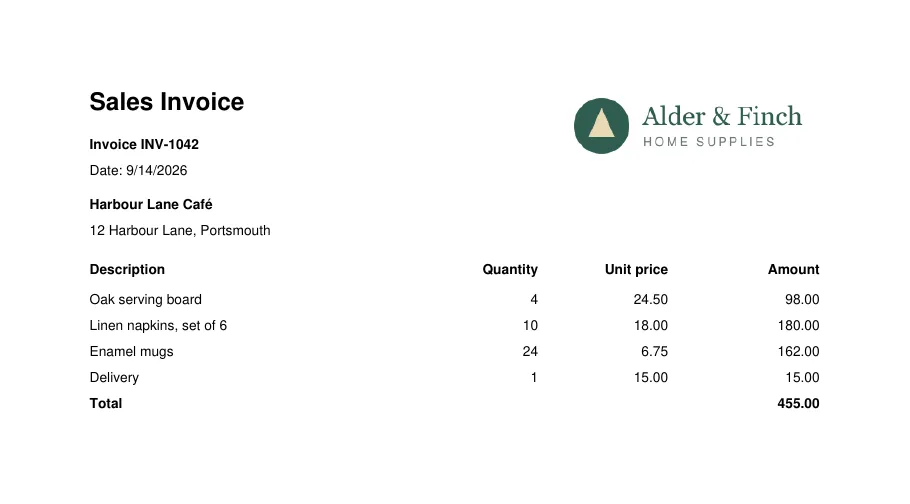
The PDF, both invoices.
A sales matrix
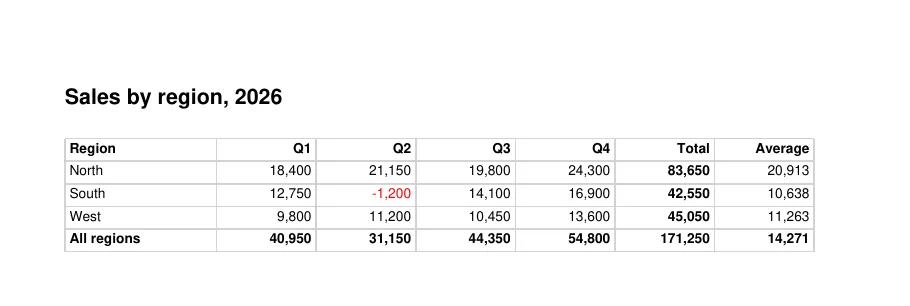
Section titled “A sales matrix”SalesByQuarter.rdlc is a cross-tab of sales by region and quarter:
- Row and column groups (regions down, quarters across), with a Total column and an All regions row.
- A column beside the quarters with its own expression: Average,
=Avg(Fields!Amount.Value). - Negative figures in red: the cells’
Coloris=IIf(Sum(Fields!Amount.Value) < 0, "Red", "Black"), in the totals too. - A parameter in the title:
="Sales by region, " & Parameters!Year.Value.
$ tagua import SalesByQuarter.rdlcSalesByQuarter.report.yaml: converted.Nothing to review.It becomes a Tagua matrix: the average is a column beside the quarter group, and the colour a conditional style
decided cell by cell, when: [ { if: "=Sum(Amount) < 0", color: "#FF0000" } ].
The converted template, SalesByQuarter.report.yaml
# Converted from SalesByQuarter.rdlc by Tagua.Import.version: 1title: SalesByQuarterculture: en-GB
page: { size: A4, margins: 56.69pt 42.52pt 56.69pt 42.52pt }
parameters:  Year: { type: int64, label: Year, default: "=2026" }
data:  Sales:    fields: { Region: string, Quarter: string, Amount: decimal }
styles:  default: { font: Arial, fontSize: 10pt }  salesByQuarterHeader:    padding: 2pt 3pt 2pt 3pt    border: "1pt solid #D3D3D3"    font: Arial    fontSize: 9pt    fontWeight: bold  salesByQuarterTotal:    padding: 2pt 3pt 2pt 3pt    border: "1pt solid #D3D3D3"    font: Arial    fontSize: 9pt    fontWeight: bold
body:  dataset: Sales  reportHeader:    - layout: absolute      height: 25.51pt      content:        - type: text          x: 0pt          y: 0pt          width: 311.81pt          value: "Sales by region, {Year}"          font: Arial          fontSize: 14pt          fontWeight: bold    - padding: 8.5pt 0 0 0      content:        - type: matrix          dataset: Sales          sort: [Region, Quarter]          rows:            - group: "{Region}"              header: Region              total: All regions              width: 99.21pt              padding: 2pt 3pt 2pt 3pt              border: "1pt solid #D3D3D3"              font: Arial              fontSize: 9pt          columns:            - group: "{Quarter}"              total: Total              beside:                - header: Average                  values: ["=Avg(Amount)"]              padding: 2pt 3pt 2pt 3pt              border: "1pt solid #D3D3D3"              font: Arial              fontSize: 9pt              fontWeight: bold              align: right          values:            - value: "=Amount"              format: N0              padding: 2pt 3pt 2pt 3pt              border: "1pt solid #D3D3D3"              font: Arial              fontSize: 9pt              align: right              when:                - { if: "=Sum(Amount) < 0", color: "#FF0000" }          columnWidth: 65.2pt          headerStyle: salesByQuarterHeader          totalStyle: salesByQuarterTotal  detail: []